Code
library(ggplot2)
library(mgcv)

# DT is just for including data in the blog
library(DT)Universities across the UK are in a pretty precarious position right now. After a host of issues, post 2020 has seen the number of students fall. The well seems to be drying up.
And in some cases dramatically. Coventry University made a £54 million loss in 2023-24. Dundee was talking about having to fire ca. 600 employees because apparently the previous senior management team weren’t too good at maths.
Now, possibly in combination with inflation and the “cost-of-living-crisis”, the long term viability of some universities is looking… Grim.
This got me thinking over the weekend as to why. What’s going on with high-school students that makes it less attractive to go to uni? I don’t know and I can’t answer this. I’d need to do a survey of school kids and universities would never pay to get evidence to make a decision. There’s no money remember? Unless it’s for an external consultancy team to tell you if you were fire red or earth green.
What I can do is look at some larger scale patterns with some crude data. It’s something, I guess. I think most people would point to faltering university recruitment and see a clear line between Brexit (and latterly, the Tories not being the most welcoming to foreigners) and the loss of the pool of European applicants.
But if that’s the case, then we shouldn’t see any similar kinds of trends in UK students applying to UK universities, right? Their numbers should be relatively stable. If you’re in Englandshire, why would you care that you can’t go to Europe if you were planning to go to Englandshire University regardless?
So that’s the idea and my question. Is there something a bit more gloabl going on than just little Britain? If UK students are relatively stable, while EU applicants fall, then it’s probably mostly because of Brexit (and associated policies) that uni recruitment is falling. And strategies to target non-EU international students may well work. But if not? Well, that’s the more “global thing”, right?
I’ll be skipping the data processing and going straight into the analysis. As such, I will only be using a few packages:
library(ggplot2)
library(mgcv)
# DT is just for including data in the blog
library(DT)To look into this I pulled some data off of the UCAS website. The UCAS site is a bit of a nightmare to navigate and an even bigger cluster fuck to figure out which of the seemingly gajillions of .csvs they’ve thrown into a zip file contain relevant information I want.
Rest assured, I have been through the valley of cluster fuckery and have emerged with a dataset. I won’t subject you to the Olympic levels of gymnastics I went through to get this but if you want a visual summary, watch The Book of Eli.
Here’s the data. All clean ’n nice like.
ucas <- read.csv("data/UCAS.csv", stringsAsFactors = TRUE, header = TRUE)
datatable(ucas, options = list(pageLength = 10, scrollX = TRUE))There are two main models fitted in this analysis: * The number of applications received by universities. * The number of acceptances (obviously conditional on an offer being made).
Worth pointing out (it is, in fact, not worth pointing out) that I appear twice in this dataset. Once in 2006 and again in 2012 after a brief stint of being a uni drop out.
I use some vaguely fancy models to do this. The gist of them is I’m just fitting something like a time series for each region of student origin, for each region of universities for each year. Vaguely, this uses something akin to temporal autocorrelation so that the predictions are a little more constrained by what’s happened in the past (I stole the crude idea from a little toy example Ben Bolker had with grant funding).
fit1 <- gam(accepted ~
             te(year, uni, origin,
                bs = c("gp", "re", "re"),
                k = c(10, 4, 6),
                m = list(c(3, 1, 1), NA, NA)) +
             s(age, bs = "re") +
             offset(log(applicants)),
           family = nb(),
           select = TRUE,
           method = "REML",
           data = ucas)

fit2 <- gam(applicants ~
             te(year, uni, origin,
                bs = c("gp", "re", "re"),
                k = c(10, 4, 6),
                m = list(c(3, 1, 1), NA, NA)) +
             s(age, bs = "re"),
           family = nb(),
           select = TRUE,
           method = "REML",
data = ucas)After fitting the models, predictions were made up to 2029 - cause let’s guess how big the fire’ll get. Below are the resulting plots.
synth <- expand.grid(
  year = seq(from = min(ucas$year),
             to = 2029,
             by = 0.1),
  uni = unique(ucas$uni),
  origin = unique(ucas$origin),
  age = "18",
  applicants = 100000
)

preds <- predict(fit1, newdata = synth, se.fit = TRUE)

synth$fit <- exp(preds$fit)
synth$low <- exp(preds$fit - preds$se.fit * 1.96)
synth$upp <- exp(preds$fit + preds$se.fit * 1.96)

# plot

ggplot(synth) +
  geom_rect(aes(xmin = 2024, xmax = 2029, ymin = -Inf, ymax = Inf),
            fill = "lightblue", alpha = 0.1) +
  geom_ribbon(aes(x = year, ymin = low, ymax = upp), alpha = 0.1) +
  geom_line(aes(x = year, y = fit)) +
  facet_grid(uni ~ origin, scales = "free_y") +
  labs(x = "Year", y = "Acceptances per 100k Applicants") +
  theme_bw()
Warning in geom_rect(aes(xmin = 2024, xmax = 2029, ymin = -Inf, ymax = Inf), : All aesthetics have length 1, but the data has 5544 rows.
ℹ Please consider using `annotate()` or provide this layer with data containing
a single row.
synth <- expand.grid(
  year = seq(from = min(ucas$year),
             to = 2029,
             by = 0.1),
  uni = unique(ucas$uni),
  origin = unique(ucas$origin),
  age = "18"
)

preds <- predict(fit2, newdata = synth, se.fit = TRUE)

synth$fit <- exp(preds$fit)
synth$low <- exp(preds$fit - preds$se.fit * 1.96)
synth$upp <- exp(preds$fit + preds$se.fit * 1.96)

# plot

ggplot(synth) +
  geom_rect(aes(xmin = 2024, xmax = 2029, ymin = -Inf, ymax = Inf),
            fill = "lightblue", alpha = 0.1) +
  geom_ribbon(aes(x = year, ymin = low, ymax = upp), alpha = 0.1) +
  geom_line(aes(x = year, y = fit)) +
  facet_grid(uni ~ origin, scales = "free_y") +
  labs(x = "Year", y = "Applicants") +
  theme_bw()
Warning in geom_rect(aes(xmin = 2024, xmax = 2029, ymin = -Inf, ymax = Inf), : All aesthetics have length 1, but the data has 5544 rows.
ℹ Please consider using `annotate()` or provide this layer with data containing
a single row.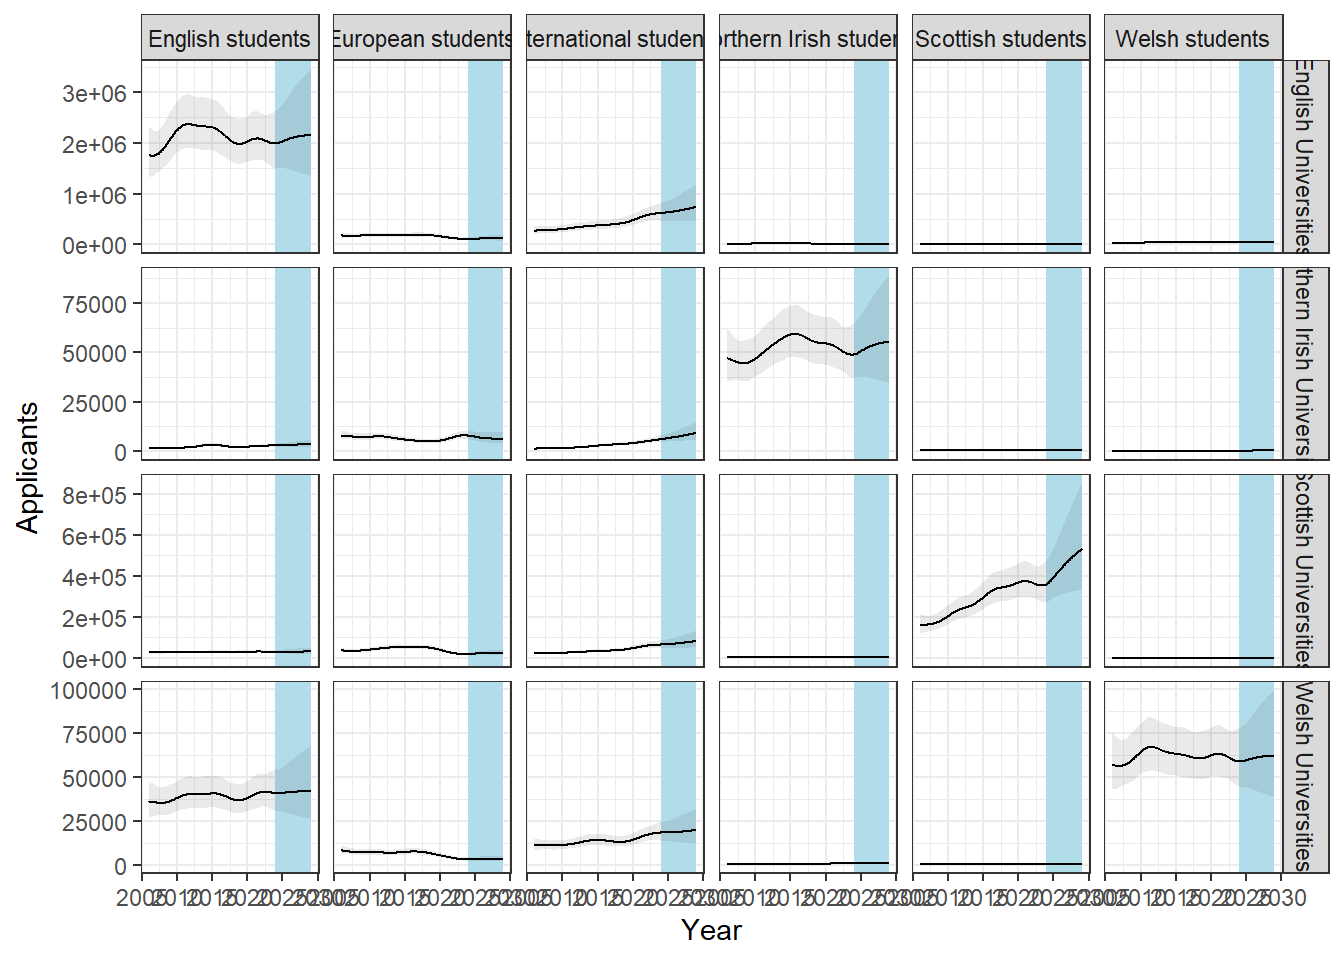
My guess at what’s driving this?
UK national student numbers have dropped in “similar” ways to non-UK students. Some of the decline in “foreign” students may well have something to do with Brexit and the Conservative government’s attitude to immigration, but I think there may be something else at play, and not something specific to the UK.
I suspect it may be the lingering effects of COVID. An entire cohort of students experienced “online” education (both its pros and cons - but probably mostly the cons, right?) and may now be less interested in continuing with formal education. There might also be an effect from their parents, who (like many of us during lockdown) reconsidered what they want from life. Is it worth sending their child off to university just to become stuck in the quagmire of being a manager one day? Do they really need little Sally to destroy their ambitions just to become a patent lawyer and earn the big bucks? Maybe not. Or maybe it’s related but less nefarious (and tin foil-y). Maybe parents simply put less pressure on their children to go to universities than they would have previously.
I have no idea. I’m speculating and waving my hands with all the spirit fingers.
But putting all of the blame exclusively on Brexit and the current government doesn’t seem justified, given the trends visible among domestic (UK) students.
Regardless of which one of the suggestions above is your preferred one - the thing is unclear to me is: Is this just a short-term blip in recruitment, or is it a sign that universities are no longer seen as the automatic “next step” after high school? That the educational culture has shifted and universities are the last to know. That’s worrying because most of the “strategies” currently being discussed are intrinsically of the view that “this’ll all blow over in a couple of days and we’ll be back to normal”. I’m not really sure that’s the case.
If the culture has shifted, then the “education-as-a-business” business model might be coming to a, crashing, ugly, and bitter end.
And I doubt many will miss the days of over-charging students to make money from people wanting to improve themselves through education.